From field data to controlled irrigation.
Compare park performance using water consumption alongside area, planting and weather conditions.
How it works
Group sites with comparable planting and irrigation methods. Do not treat total volume alone as a performance score. Mark new planting, failures, maintenance and missing readings, and normalise comparisons across different weather conditions.
Data used
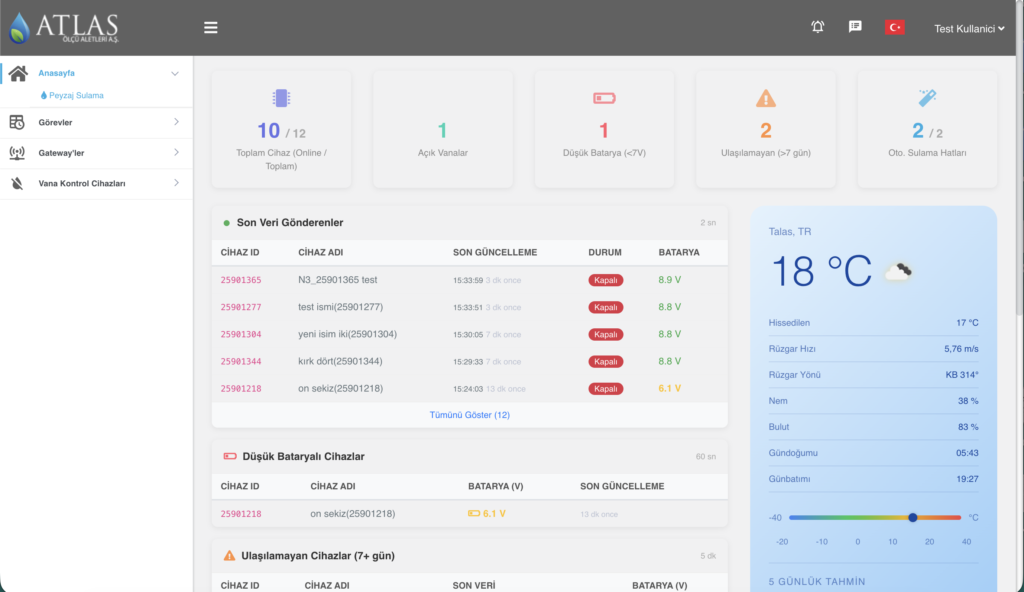
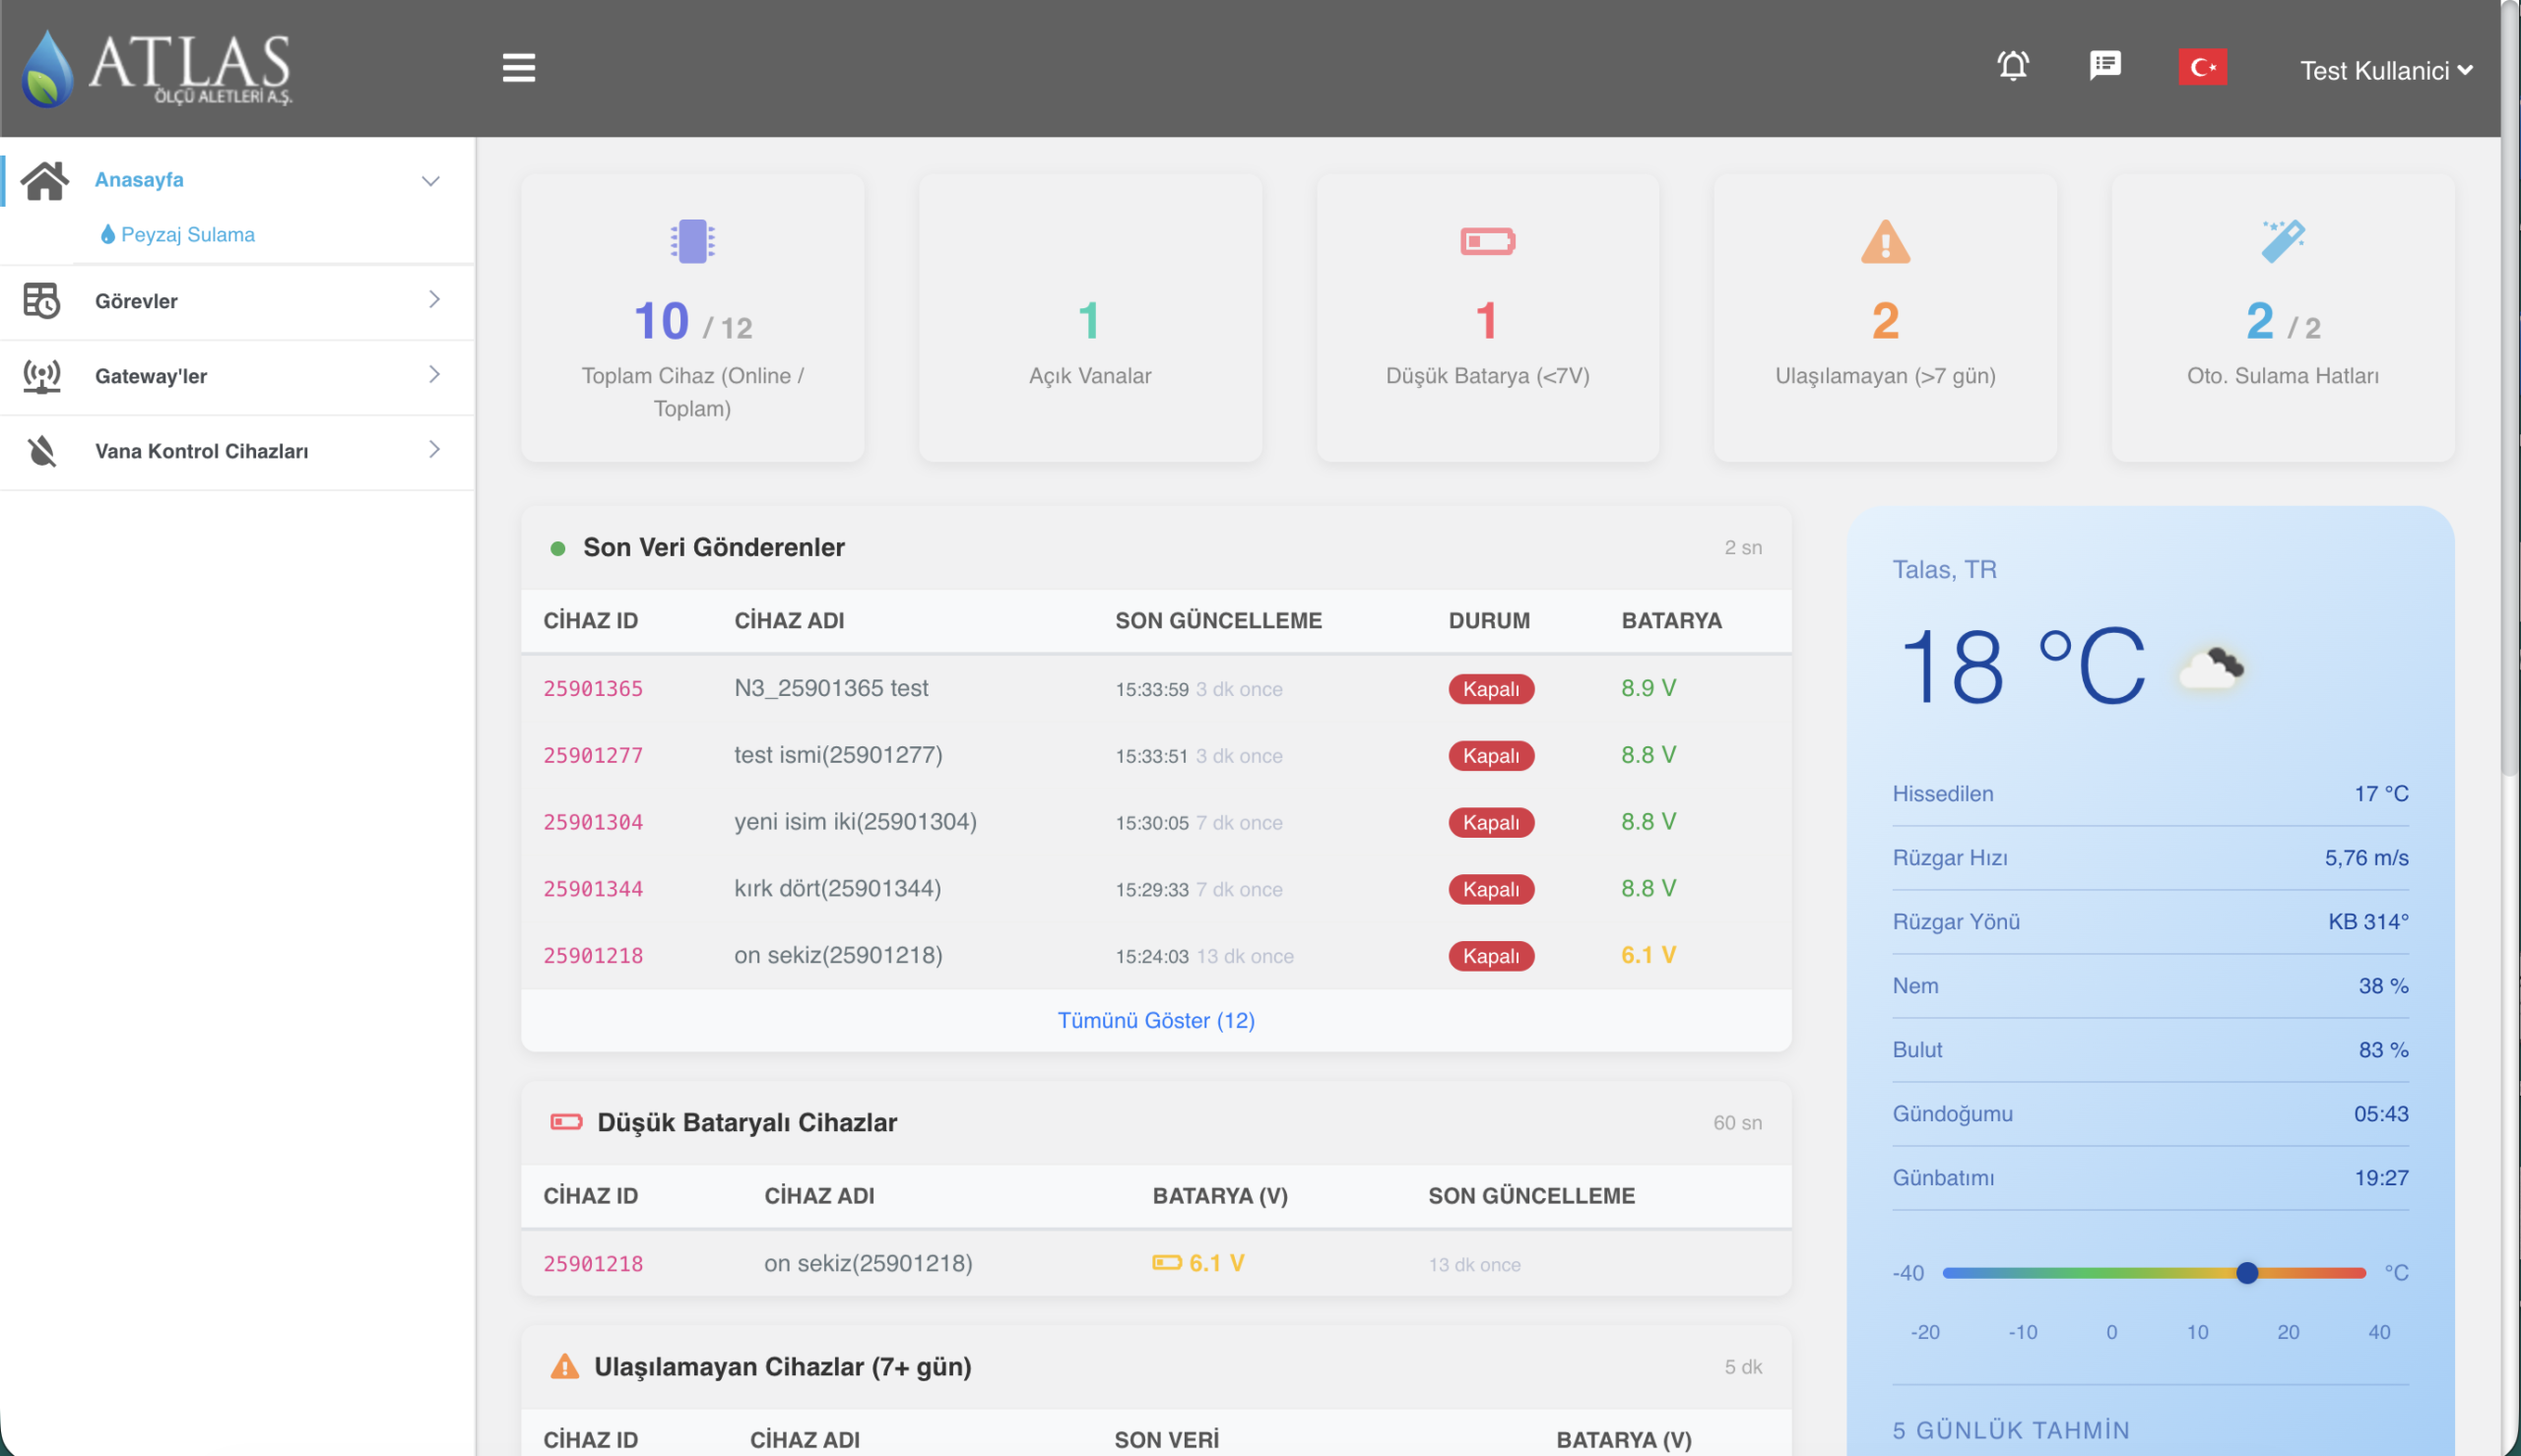
Consumption in m³; irrigated area in m²; m³/m²; runtime; effective rainfall; ET₀; data completeness; energy use where measured.
Design and commissioning
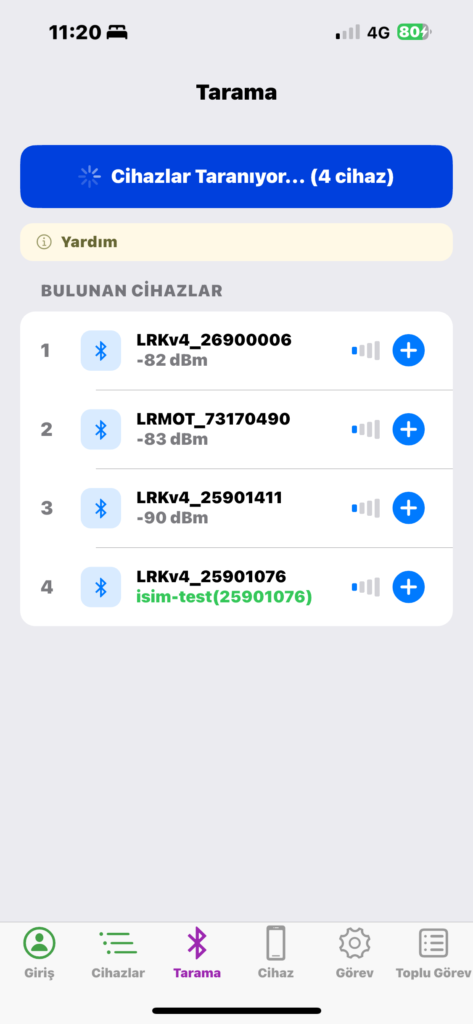
Define scope by evaluating site topology, planting and soil, selected devices, sensors and software version together. For retrofit projects, establish valve/coil compatibility, measurement points, communication coverage and operational responsibilities during the survey.
Verify area-to-meter mapping, reconcile period totals with meter records, and test the visibility of missing data.
The next step
Climate-normalised benchmarking, comparable-site clusters and AI explanations of likely deviation causes.
This section describes development and project-specific integration objectives. It is not a claim of standard product availability or guaranteed performance; implemented functions are defined in the quotation and acceptance criteria.
Applications
Municipal parks, public gardens, university campuses, industrial-zone landscapes, residential estates, hotels, sports facilities and road medians. As zone and site counts grow, standard asset records, traceable actions and measured management become essential.
Plan your landscape irrigation project with us.
Share the site area, valve count, existing connectivity and project objectives. We can define device selection, coverage survey, integration and pilot requirements together.
Request a project quotationContact our technical team